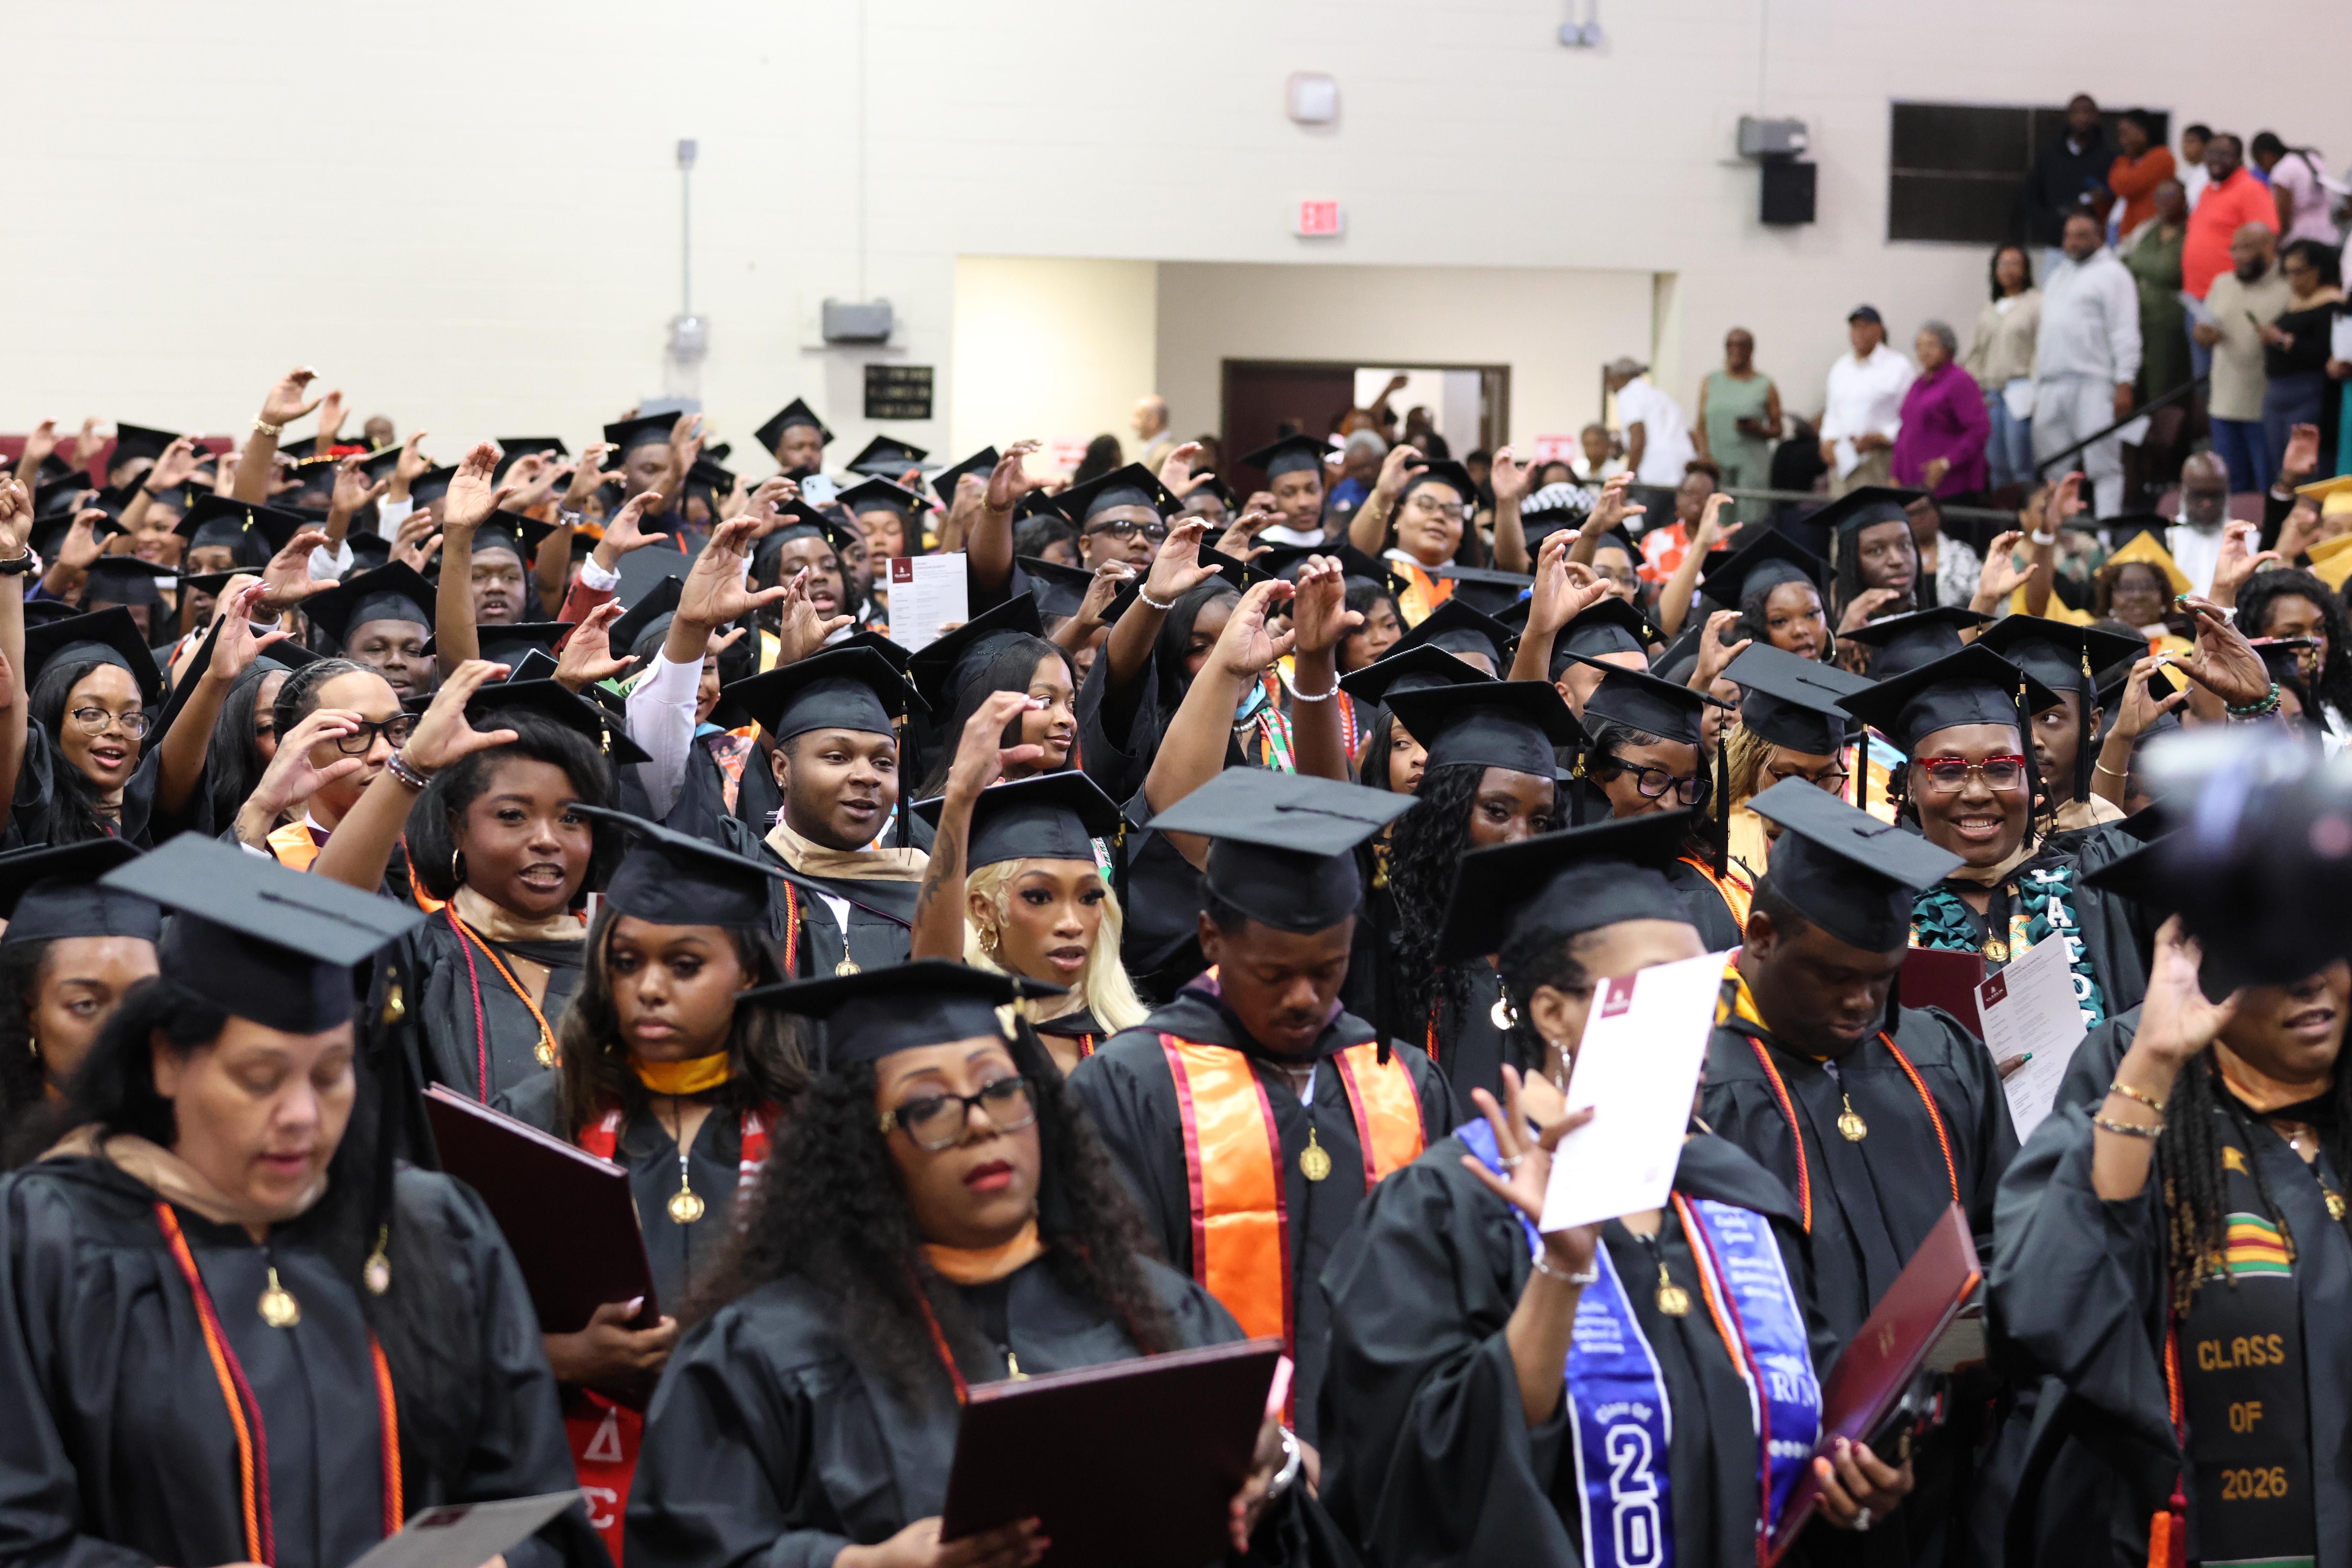
Claflin University students and campus life
October 2026 Claflin Poll

Claflin Poll – 2026 Midterm Elections

The October 2026 Claflin Poll finds Jermaine Johnson ahead of Alan Wilson in the governor's race, and Dr. Annie Andrews ahead of Darlene Graham in the U.S. Senate race among surveyed South Carolina registered voters. Most respondents say they intend to vote, while cost of living and inflation dominate the issues respondents identify as most important in choosing a governor.

October 21, 2026

October 2026 Claflin Poll

Public Opinion and Social Behavior Research Institute at Claflin University | October 21, 2026

The October 2026 Claflin Poll finds Jermaine Johnson ahead of Alan Wilson in the governor's race, and Dr. Annie Andrews ahead of Darlene Graham in the U.S. Senate race among surveyed South Carolina registered voters. Most respondents say they intend to vote, while cost of living and inflation dominate the issues respondents identify as most important in choosing a governor.

POSBRI surveyed 751 South Carolina residents who self-reported as registered voters in an online survey conducted from October 15–20, 2026. The survey was run with Prodege's Pollfish platform. Results are unweighted. Candidate preferences include all 751 respondents, regardless of their stated likelihood of voting.
Finding 1

The Decision to Vote

Registered voters who participated in the Claflin poll survey show a high intent to vote. More than two-thirds of respondents (68.2%) say they definitely will vote in November, and 16.9% say they probably will vote. Together, these groups account for 85.1% of respondents. These numbers indicate relatively high voter interest in this year's midterm election. If this enthusiasm among registered voters holds through early voting and up to Election Day, voter turnout is expected to be higher than in other midterm cycles.

Table 1: How likely are you to vote in the November midterm elections?
ResponsePercent
Definitely will vote68.2%
Probably will vote16.9%
Might or might not vote9.5%
Probably will not vote3.6%
Definitely will not vote1.9%

NB: These responses describe stated intentions rather than a projected statewide turnout rate. Actual participation will depend on whether respondents follow through on their plans.

Finding 2

The Races Attracting the Most Interest

The race drawing the most attention among registered voters in the State in this cycle is the governor's race. With an open gubernatorial office, registered voters in our survey pointed to this race as the race that attracted the most interest. The Senate race between Sen. Darlene Graham, who is serving out the remainder of her late brother Lindsey Graham's term, and Dr. Annie Andrews is also attracting attention among the voters we surveyed and has significant national attention. Table 2 shows the level of interest among the registered voters surveyed.

Table 2: Which of the following races are you most interested in?
ResponsePercent
Governor of South Carolina40.7%
U.S. Senate37.8%
U.S. House of Representatives9.3%
South Carolina state legislative races6.7%
Other state or local elections5.5%
Finding 3

How Respondents Plan to Vote

Along with high interest, survey participants have clear voting plans. In-person voting is the preferred method for most respondents: 52.6% plan to vote on Election Day and 34.2% plan to vote early in person. Table 3 shows that mail-in or absentee ballots are not favored among registered voters in the state. Some participants are still unsure how they will cast their ballot, and this could correlate with turnout on Election Day.

Table 3: How do you plan to cast your ballot?
ResponsePercent
Early voting in person34.2%
Election day voting in person52.6%
Mail-in/absentee voting5.3%
Not sure7.9%

NB: These percentages include all respondents, including those who express uncertainty about whether they will vote. They describe intended methods rather than the distribution of ballots ultimately cast.

Finding 4

The Governor's Race

The state's gubernatorial race is shaping up to be more competitive this year as Republican Attorney General Alan Wilson takes on state legislator, Dr. Jermaine Johnson. Our survey of registered voters in the state, less than a month to election day, shows Jermaine Johnson ahead of Alan Wilson in the statewide poll. The number of registered voters who said they were undecided in this race makes the lead quite fragile. The 5-percentage-point lead going into the last couple of days of the cycle could shrink as more registered voters decide. Table 4 shows the level of support for the gubernatorial candidates at the time of the survey – October 16th to 20th, 2026.

Table 4: If the election for governor of South Carolina were held today, who would you vote for?
ResponsePercent
Alan Wilson37.7%
Jermaine Johnson43.5%
Another Candidate2.7%
Undecided12.8%
Would not vote3.3%
Finding 5

The Most Important Issue in Choosing a Governor

When asked about the most important issue influencing their choice for governor, registered voters point to the cost of living and Inflation. As in races across the country, the cost-of-living crisis, inflation, and the overall state of the economy have become major drivers of voters' choices in the poll. Table 5 presents the leading issues driving registered voters to the poll in South Carolina this November.

Table 5: What is the most important issue in deciding your vote for governor?
ResponsePercent
Infrastructure9.9%
Taxes and state spending19.3%
Education6.5%
Cost of living and inflation56.7%
Not sure4.5%
Other3.0%
Finding 6

The US Senate Race

In the Senate race, Dr. Annie Andrews leads Darlene Graham in support among registered voters statewide. Table 6 shows how registered voters responded to the question of which candidate they would choose to replace Sen. Lindsey Graham. Dr. Annie Andrew's lead is significant but will be tested as President Trump visits the state in the last few weeks of the campaign cycle to support Darlene Graham – whom he has strongly endorsed. The percentage of undecided voters (13.7%) is high enough for the Republican Candidate to close the gap on election day.

Table 6: If the U.S. Senate election in South Carolina were held today, who would you vote for?
ResponsePercent
Dr. Annie Andrews47.1%
Darlene Graham35.4%
Another Candidate3.7%
Undecided13.7%
Finding 7

The Role of President Trump in Voting Decisions

President Trump has been campaigning for Republican House and Senate members across the country, and one central message of his campaign has been for voters to pretend he is on the ballot. The Claflin poll asked registered voters if the President's message is influencing their choices in this election. Table 7 shows the study participants' responses. About 65.7% of registered voters statewide said President Trump was a factor in their choice; however, 40.5% of voters said they were voting to oppose President Trump. The President's influence on voters will be tested in November's election, with Republican candidates hoping his campaign visits will mobilize much more support in their races.

Table 7: When deciding how to vote in 2026, will your vote be mainly to support President Trump, mainly to oppose President Trump, or will President Trump not be a factor?
ResponsePercent
Mainly to support President Trump25.2%
Mainly to oppose President Trump40.5%
President Trump will not be a factor26.9%
Not sure7.5%

NB: This question measures Trump's role in respondents' voting decisions. It is not a presidential job approval question, and it does not establish that views of Trump caused respondents' candidate choices.

Survey results

Participants' Demographic Descriptions

Here are some tables that show the demographic attributes of the survey participants.

Table 8: How old are you?
ResponsePercent
18-2411.3%
25-3418.2%
35-4415.8%
45-5416.4%
55-6416.8%
65 and over21.4%
Table 9: What is your gender?
ResponsePercent
Male49.0%
Female50.7%
Non-binary/Other0.3%
Table 10: What is your race/ethnicity?
ResponsePercent
White66.8%
Black or African American27.6%
Hispanic or Latino3.1%
Asian1.2%
Native American0.7%
Other0.7%
Table 11: What is your marital status?
ResponsePercent
Single35.2%
Married42.5%
Separated2.1%
Divorced9.6%
Widowed5.6%
Cohabiting5.1%
Table 12: What is your annual Household income?
ResponsePercent
Less than $25,00014.4%
$25,000 to $49,99923.2%
$50,000 to $74,99920.4%
$75,000 to $99,99914.1%
$100,000 to $149,99919.4%
$150,000 or more8.5%
Table 13: What is the highest level of education you have received?
ResponsePercent
Less than high school2.3%
High school diploma or GED28.5%
Some college21.0%
Associate's degree13.0%
Bachelor's degree23.8%
Graduate degree11.3%
Table 14: How would you describe the neighborhood you live in?
ResponsePercent
Urban15.3%
Suburban54.6%
Rural30.1%
Table 15: Generally speaking, how would you describe your political views?
ResponsePercent
Very liberal10.7%
Liberal15.4%
Moderate37.3%
Conservative17.8%
Very Conservative15.2%
Not sure3.6%
Methodology

About the Poll

The Claflin Poll was conducted by the Public Opinion and Social Behavior Research Institute (POSBRI) at Claflin University using the Pollfish online survey platform. Data were collected October 15–20, 2026, from 751 South Carolina residents who self-reported being registered to vote.

Results are unweighted and describe the respondents surveyed. All results presented here use the full sample of 751 unless a smaller response base is stated. Percentages are rounded to one decimal place and may not total 100%. Combined percentages and differences are calculated from unrounded results. The findings should be read with the limitations of online recruitment, possible nonresponse and coverage bias, and self-reported attitudes and behavior in mind. They represent a snapshot during the survey period, not a forecast of election results. Detailed analyses and weighted survey results will be made available in Spring 2027.

About POSBRI

The Public Opinion and Social Behavior Research Institute at Claflin University conducts survey research and data analysis to advance understanding of public opinion, political participation, and social behavior in South Carolina and beyond.

For media inquiries or information about the poll, contact Kwadwo Poku-Agyemang, Director, POSBRI, at kpokuagyemang@claflin.edu or (225) 421-4011.

Media inquiries

Contact POSBRI

Portrait of Dr. Kwadwo Poku-Agyemang

Dr. Kwadwo Poku-Agyemang

Public Opinion and Social Behavior Research Institute (POSBRI) Claflin University

POSBRI

Explore More Claflin Research.

Read past polls, election briefs, and the institute's survey services.